
The Presentation Company (TPC) and our client partner, Kraft Heinz, packed the house for the second-straight year at the 2024 CMA | SIMA conference in ...Continue Reading

After leading a top-rated session at last year’s Category Management Association/Shopper Insights Management Association conference, we are so excited to make a return to the ...Continue Reading

As we sit in 2023, and another squirrely year of disruption and economic uncertainty, many are feeling enough is enough, and next year is THE ...Continue Reading

Thanks to today’s data-driven culture, we all live in dashboards. Whether you’re logging on to Salesforce, Tableau, Google Data Studio, or Power BI, odds are ...Continue Reading
Back by popular demand! It was a packed house at the 2023 Category Management Association/Shopper Insights Management Association conference for one big reason: the top-rated ...Continue Reading
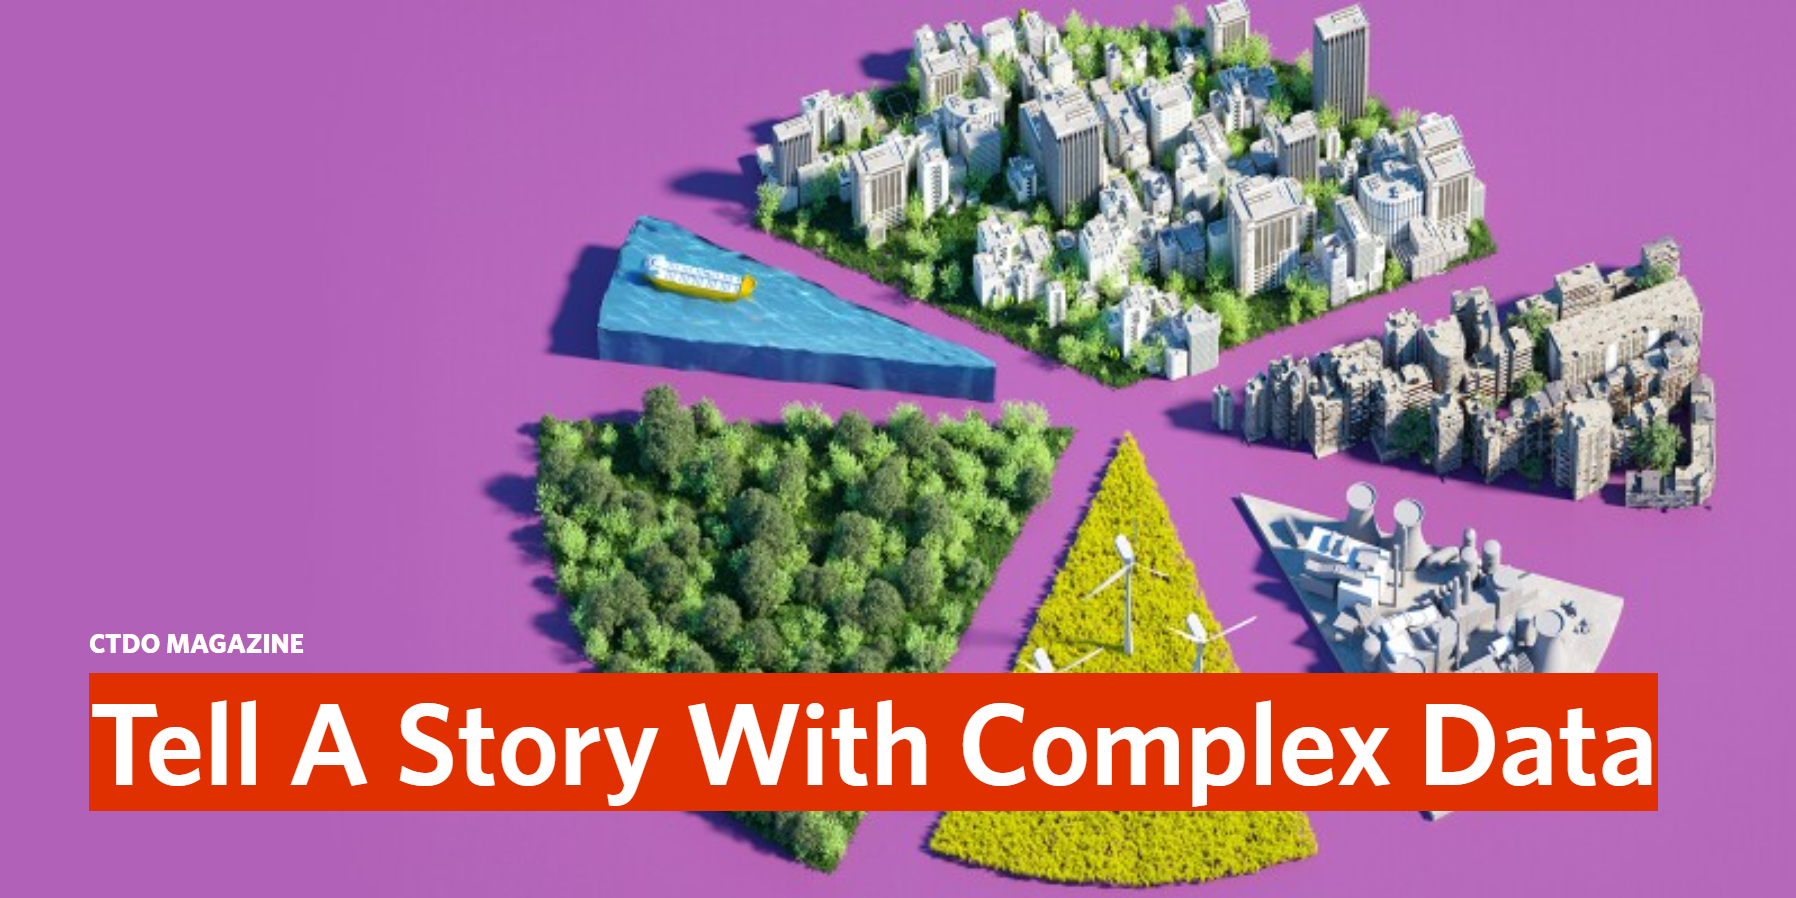
Use these five methods to strategically present data to stakeholders.
As a talent development executive, you help organizations grow and transform their workforces. As such, you're ...Continue Reading
![Don’t Leave Your Data Behind [VIDEO]](https://www.presentation-company.com/wp-content/uploads/2022/01/Janine-still_with-play-button-1.png)
Did you know virtual meetings can be a goldmine full of insights? That’s right… all of those chat conversations, poll responses, and whiteboard brainstorm sessions ...Continue Reading
![How Shapes Make Your Data Insights POP [VIDEO]](https://www.presentation-company.com/wp-content/uploads/2022/01/Janine_Shapes_Still-02.png)
Shapes can be incredibly powerful. It’s a statement you’ve probably never heard before, but it’s true—circles, squares, and triangles can really pack a punch when ...Continue Reading
![Size Up Your Data: How Varying Size Draws Focus to Your Insights [VIDEO]](https://www.presentation-company.com/wp-content/uploads/2022/01/Daren_Size_Still-02.png)
Have you ever considered how the size of your data display could impact how well your insights are received by your audience? Odds are… probably ...Continue Reading
![Do This, Not That: How to Choose Color for Data Visualizations [VIDEO]](https://www.presentation-company.com/wp-content/uploads/2022/01/Kevin-with-watch-now_Accentuate-with-color.png)
Let’s talk about one of data visualization’s best friends: color. When used correctly, color can be a powerful conduit for making your data insights shine. ...Continue Reading
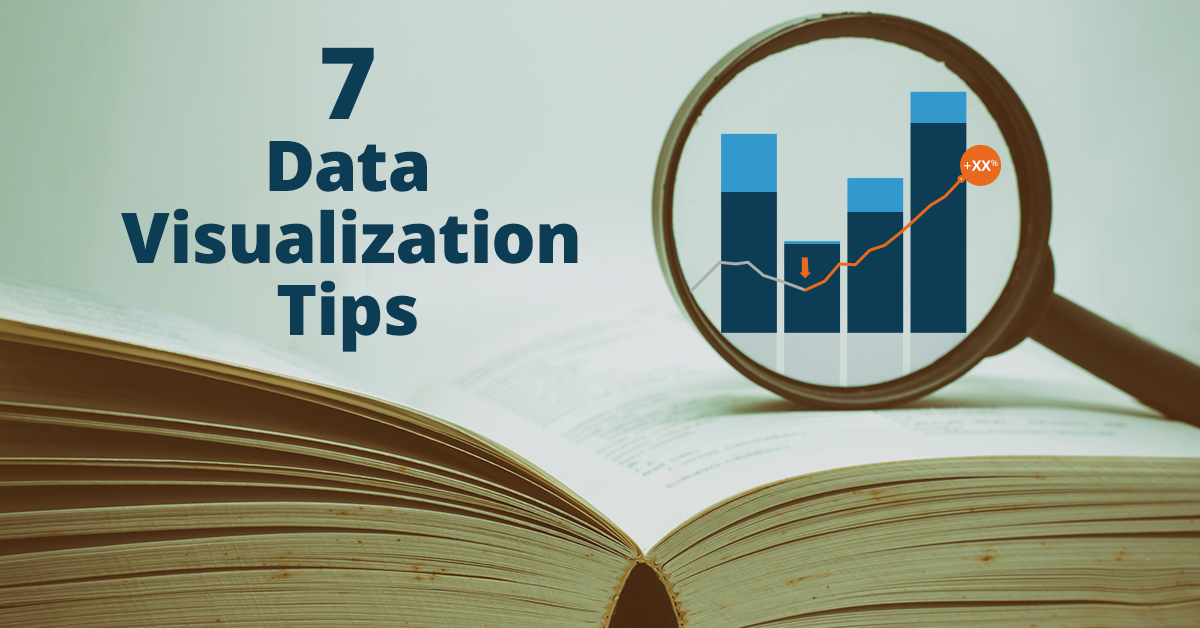
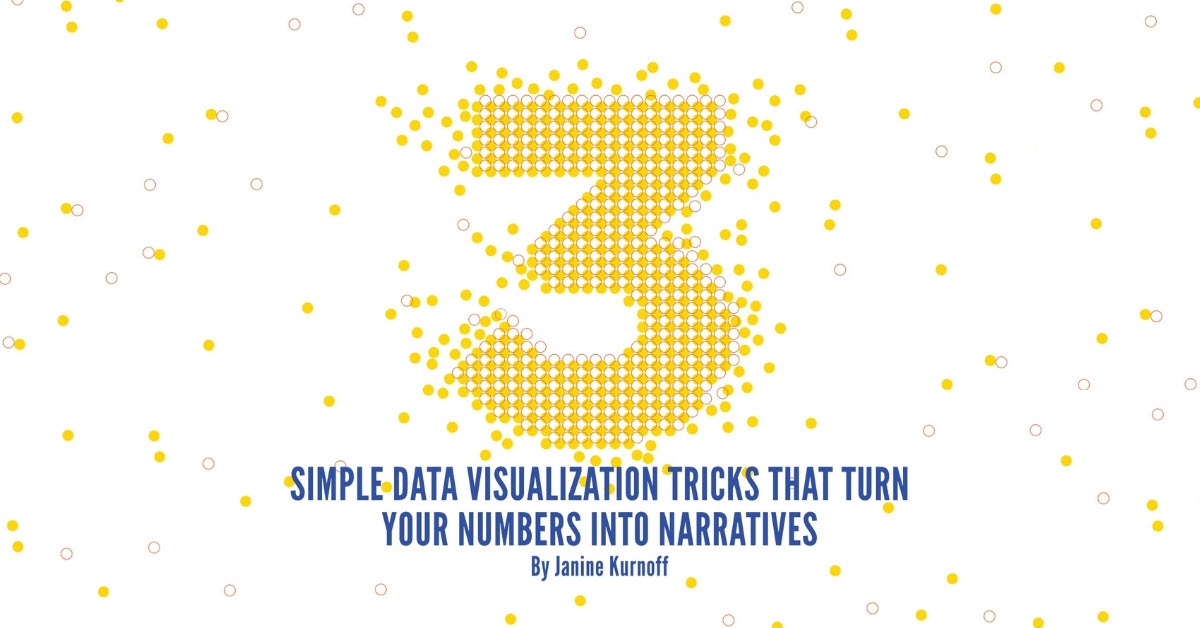
TPC Contributes to Training Industry: Drowning in Data? These 3 Simple Visual Tricks Will Rescue You

Picture this: Your team is prepping for a presentation to win a big deal … or have a budget approved … or (fill in the ...Continue Reading
![The Best Kept Secret to Telling A Compelling Data Story [VIDEO]](https://www.presentation-company.com/wp-content/uploads/2022/01/Grey_Thumbnail-03.png)
One of the most common—yet dangerous—mistakes you can make when creating data visualizations is making your audience work hard to understand your key insights. The good news? ...Continue Reading
![Boost Your Data Visualizations: Try Thinking “Outside the Chart” [VIDEO]](https://www.presentation-company.com/wp-content/uploads/2022/01/Janine-Thumbnail-03.png)
Data justifies nearly every business decision we made. But too often, our valuable insights get buried among the "noise" of traditional charts and tables. Our best ...Continue Reading
These days, it’s a battle royale trying to hold people’s attention. To make matters worse, we often needlessly clutter our slides with data and obscure ...Continue Reading

There are many charts options for displaying your data. So how do you choose the one that is going to make your numbers shine? Better ...Continue Reading
We’re addicted to data. It helps us find golden revenue opportunities. It helps us slash project costs. Whatever path we seek or decision we are ...Continue Reading
We live in a data-driven world. But we don’t spend huge amounts of time and money collecting data just for fun. We look for numbers ...Continue Reading
Ask any executive what their biggest frustrations are and, invariably, they will answer, “long-winded, unfocused presentations that pack in too much data.” Modern institutions – ...Continue Reading
Looking for simple yet powerful data visualization techniques? We've made it easy. TPC Co-founder and data storytelling expert Janine Kurnoff demonstrates some of her favorite ...Continue Reading
Throwing a bunch of tables and charts into a presentation doesn’t make for great data visualization – just ask your boss. :-) Nobody wants to ...Continue Reading